 Click Here to View the June 2018 Home Sales Report
June Home Sales Dip 5 Percent, New Contracts Rise 5 Percent, Housing Supply Still Lean as Slower Summer Months Approach,
Lenders Offer New Products for Interest Rate Locks
Reports the Northern Virginia Association of Realtors®
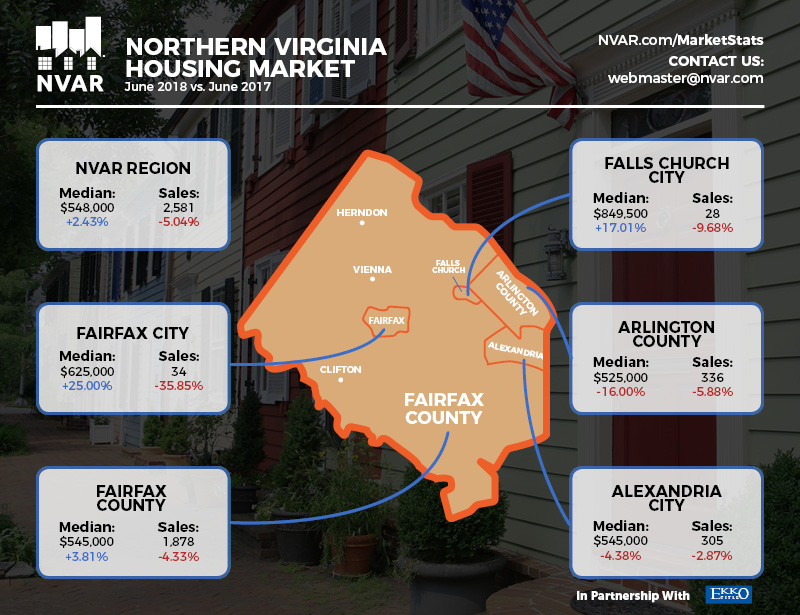
Fairfax – Even though the housing market nationally has leveled off, Northern Virginia buyers successfully closed on 2,581 homes in June. These sales amount to a modest decrease of 5 percent compared to the 2,718 homes sold one year ago. This is no cause for concern when looking at the big picture of Northern Virginia home sales trends this year.
“The slight decline in this past month’s home sales reflects that summertime is upon us, people are busy with plans, and clients recognize that housing choices have been limited,” said Lorraine Arora, NVAR chairman of the board. “Also, people may not fully understand the federal tax laws and how that effects the benefits of home ownership. The new federal tax laws limit deductions on state and local taxes to $10,000 a year, which includes property taxes,” Arora explained.
Northern Virginia properties, in most neighborhoods, still gain equity,” Arora continued. “Low interest rates coupled with strong regional employment have been instrumental in helping ready buyers pull the trigger and buy that first home or their move-up home.”
Christine Richardson, NVAR Chair-Elect, and Realtor® with Weichert Great Falls pointed out that this June’s average sales price of $601,928 is practically the same as last June’s of $602,045. “Demand for homes in Northern Virginia continues to be strong, even though supply continues to be low,” said Richardson. “What does all this mean for home sellers?” she asked. “They are likely to sell quickly, provided the home is priced right,” she explained. “Buyers will have to be quick as the best of the well-priced homes will likely attract multiple offers. Traditionally, activity — both among buyers as well as sellers — slows down in July and August and then picks up again in the fall.”
According to NVAR CEO Ryan Conrad, “When the ‘New-Under-Contract’ numbers rise by 5 percent, we know that qualified buyers are making decisions before interest rates rise again. The median sales price of $548,00 rose about 2½ percent, which is a sign of a stable market. A median sales price means that half of all homes sold above that price, and the other half sold below.
“Of all homes sold in June, 43 percent sold below $500,000,” Conrad said. This lean supply of entry level housing tops the list of our market challenges, he continued.
Said NVAR Board of Director Rob Allen, “June marked the 19th straight month of median price increases when compared to that time in the previous year. That goes all the way back to December 2016.”
Allen, an associate broker with Long & Foster in Reston, urges his clients to secure financing before their home selection for peace of mind. “I've found buyers with an increased sense of urgency due to those rising rates,” he explained. “Many lenders have rolled out new creative programs that allow qualified prospective purchasers to lock rates for an extended amount of time without a sales contract. I've encouraged my clients to take advantage of these programs, so they can focus on finding a home that's perfect for them.”
June 2018 Regional Home Sales Compared to June 2017: Northern Virginia
The Northern Virginia Association of Realtors® reports on June 2018 home sales activity for Fairfax and Arlington counties, the cities of Alexandria, Fairfax and Falls Church and the towns of Vienna, Herndon and Clifton.
A total of 2,581 homes sold in June 2018, a 5 percent decrease below June 2017 home sales of 2,718.
Active listings decreased this month compared with 2017. Listings were down 11.56 percent below last year, with 3,945 active listings in June, compared with 4,462 homes available in June 2017. The average days on market (DOM) for homes in June 2018 was 27 days, a decrease of 15.63 percent compared to the 32 DOM for homes in June 2017.
The average home sale price remained constant compared with last June, at $601,928. This is less than one tenth of 1 percent below the June 2017 average price of $602,045.
The median sold price of homes this June, which was $548,000, rose by about 2 1/2 percent compared to June 2017, when the median price was $535,000.
The 2,296 new pending home sales in Northern Virginia in June were 5.46 percent below the 2,400 contracts that were pending in June last year. Total pending sales of 2,747 in June were down by about 9 percent, compared with 3,030 pending contracts in June 2017.