Recent News
National Market Statistics Comparison: December 2025
The Northern Virginia Association of Realtors® reports on December 2025 home sales activity in Northern Virginia compared to real estate activity…
January 22, 2026

Market Statistics: 2025 Year End Totals & December 2025
The Northern Virginia Association of Realtors® reports on how 2025 home sales activity performed in throughout the year and in December.
January 13, 2026

2026 Regional Housing Market Forecast
The Northern Virginia housing market will continue to find balance in 2026, with moderate price increases, interest rates that hover…
December 29, 2025

Market Statistics: November 2025
The Northern Virginia Association of Realtors® reports on November 2025 home sales activity for Fairfax and Arlington counties, the cities…
December 11, 2025

National Market Statistics Comparison: October 2025
The Northern Virginia Association of Realtors® reports on October 2025 home sales activity in Northern Virginia compared to real estate activity…
November 20, 2025

Future in Practice: AI and Forward-Thinking Tools from NVAR’s 2025 Leadership Institute Class
As part of their capstone project, the 2025 NVAR Leadership Institute class developed in-depth presentations exploring emerging technologies, their implications for…
February 4, 2026

NVAR Launches New Complimentary Member Benefit: Keeping Current Matters
Beginning February 2, the Northern Virginia Association of Realtors® (NVAR) will launch a new benefit offering Realtor® members complimentary access…
February 3, 2026

Your Trusted Resource When Questions Arise: NVAR’s Legal Hotline
In real estate, the right answer can make all the difference. From contract concerns to compliance questions, Realtors® face complex…
January 28, 2026

NVAR CEO Ryan McLaughlin Recognized on the 2026 Swanepoel Power 200
The Northern Virginia Association of Realtors® (NVAR) is proud to share that NVAR CEO Ryan McLaughlin has been named to the 2026…
January 15, 2026

NVAR Recognized in Washington Business Journal’s 2026 Book of Lists
The Northern Virginia Association of Realtors® (NVAR) is proud to be recognized in the Washington Business Journal’s 2026 Book of Lists, a respected…
January 15, 2026

Realtors® Make Their Voices Heard at the 2026 NVAR Realtor® Lobby Day
The 2026 Virginia General Assembly session officially began on January 14, and we are closely tracking legislative activity that will…
February 3, 2026

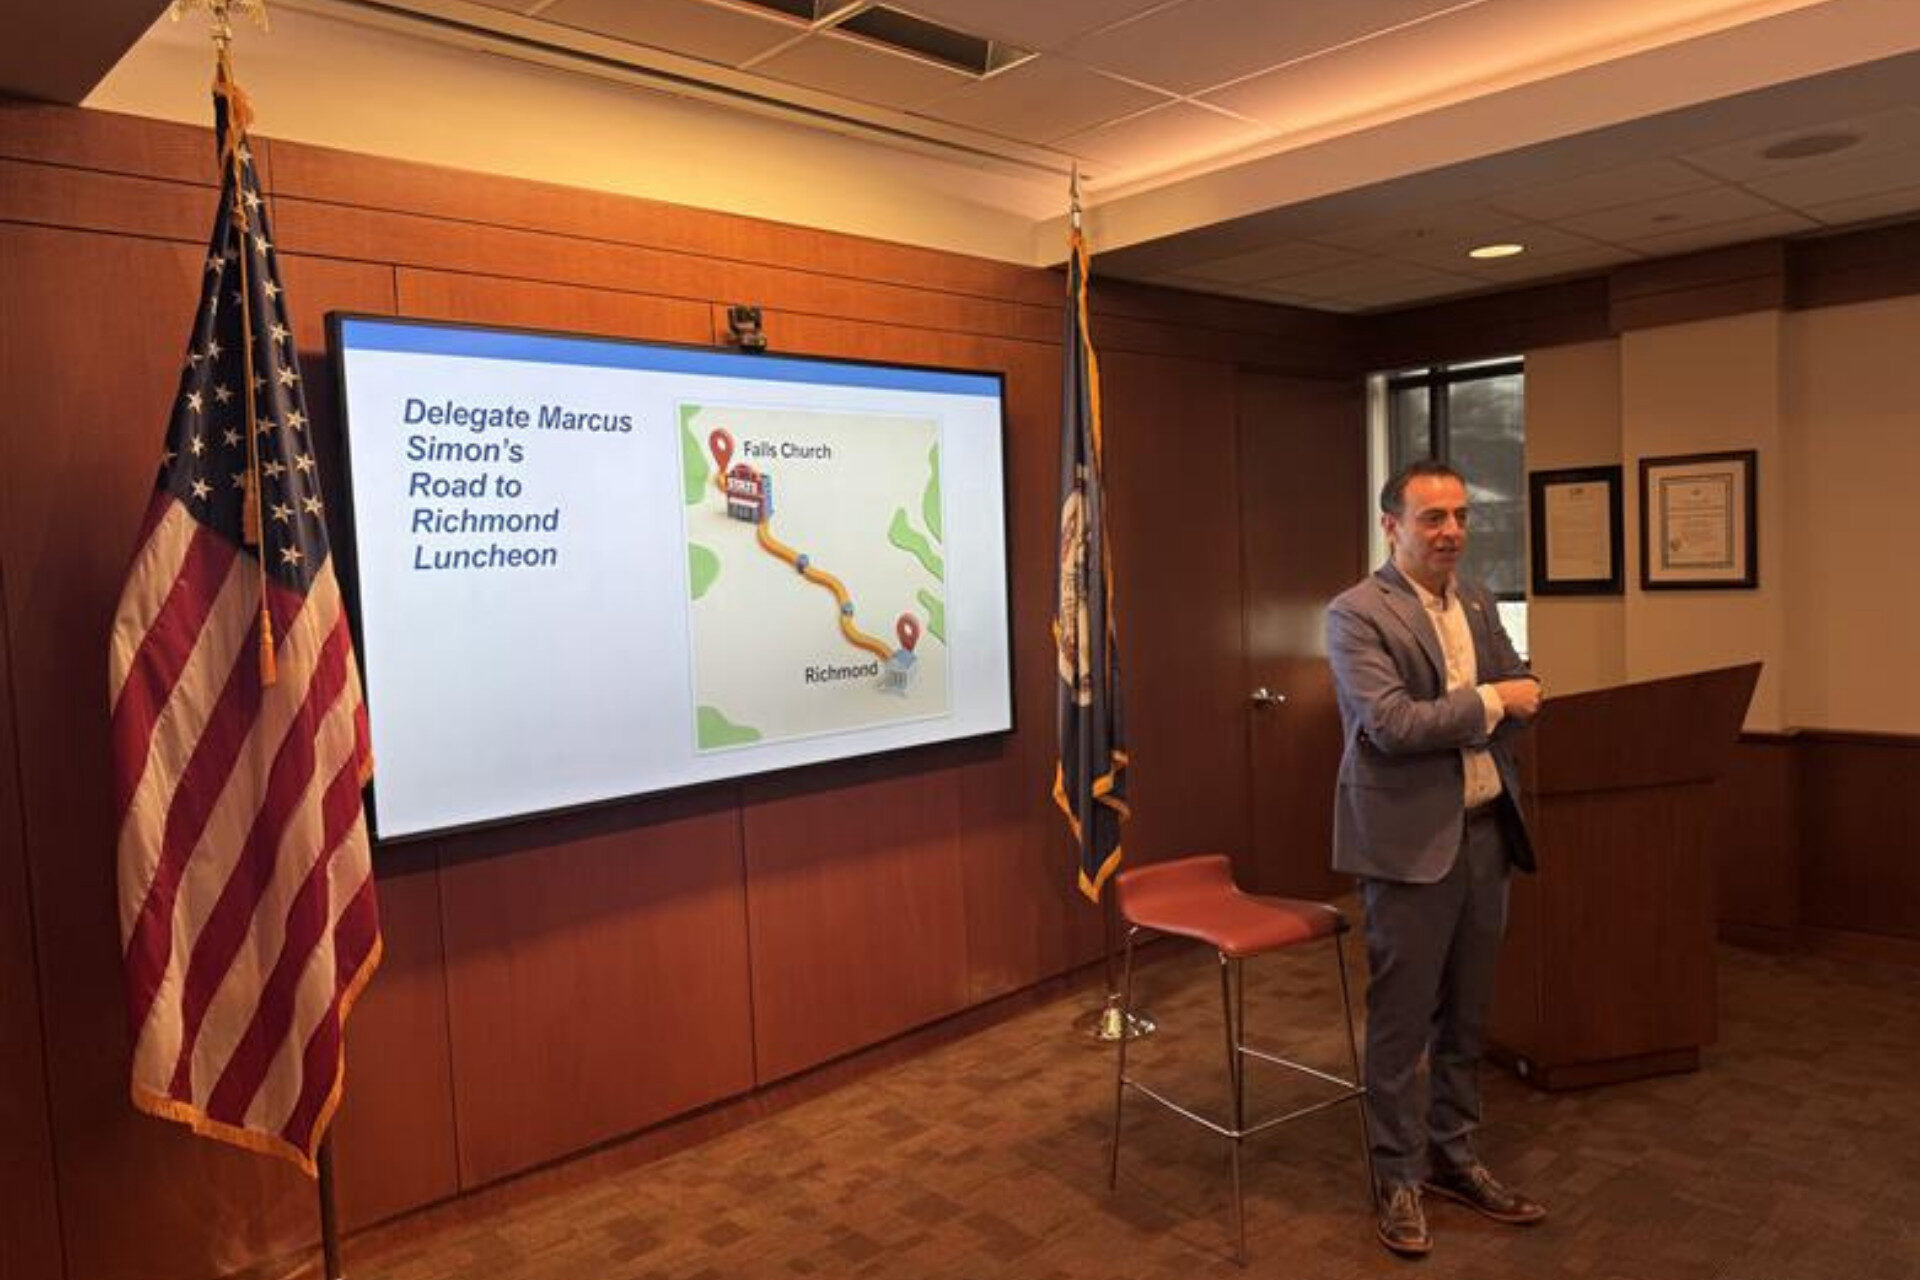
Delegate Marcus Simon’s “Road to Richmond” Luncheon Kicks Off the 2026 Legislative Session
The Northern Virginia Association of Realtors® (NVAR) recently welcomed members and housing-forward professionals to its Fairfax Headquarters for one of…
January 16, 2026

Virginia General Assembly Begins — Realtors® Ready to Advocate for Housing Solutions
The 2026 Virginia General Assembly session officially began on January 14, and we are closely tracking legislative activity that will…
January 16, 2026

FIVE FOR FRIDAY: A Weekly Roundup of Public Policy News
Welcome to FIVE FOR FRIDAY: A weekly roundup of public policy issues and headlines from around the Northern Virginia Region,…
January 9, 2026

FIVE FOR FRIDAY: A Weekly Roundup of Public Policy News
Welcome to FIVE FOR FRIDAY: A weekly roundup of public policy issues and headlines from around the Northern Virginia Region,…
December 12, 2025

Standard Forms Changes — July 1, 2025
The NVAR Board of Directors has approved new forms and forms changes, as proposed by the NVAR Standard Forms Committee.…
June 4, 2025

January 1, 2025, Standard Forms Updates
The NVAR Board of Directors has approved the below new forms and forms changes, as proposed by the NVAR Standard…
November 25, 2024

Special Standard Forms Changes – August 14, 2024
The NVAR Board of Directors has approved the below new forms changes. The changes will be effective August 14, 2024.
August 5, 2024

Standard Forms Changes – July 1, 2024
The NVAR Board of Directors has approved the below new forms changes, as proposed by the NVAR Standard Forms Committee…
May 29, 2024

January 1, 2024 Standard Forms Updates
The NVAR Board of Directors has approved an update of the following forms changes, as proposed by the NVAR Standard…
November 28, 2023

Your Trusted Resource When Questions Arise: NVAR’s Legal Hotline
In real estate, the right answer can make all the difference. From contract concerns to compliance questions, Realtors® face complex…
January 28, 2026

Standard Forms Changes — July 1, 2025
The NVAR Board of Directors has approved new forms and forms changes, as proposed by the NVAR Standard Forms Committee.…
June 4, 2025

FAQs on NAR’s New Multiple Listing Options for Sellers Policy
The National Association of REALTORS® (NAR) recently announced that it will keep its Clear Cooperation Policy (CCP) in place and…
March 28, 2025

Judge Approves NAR Settlement in Sitzer/Burnett Case
The National Association of REALTORS®’ settlement resolving antitrust claims brought against NAR and others in the Sitzer/Burnett case has been…
November 27, 2024

January 1, 2025, Standard Forms Updates
The NVAR Board of Directors has approved the below new forms and forms changes, as proposed by the NVAR Standard…
November 25, 2024

Looking for more expert analysis?
Virginia Association of REALTORS®
View the archive of Virginia REALTORS® press releases on housing market statistics, leadership and community engagement, and policy issues.
National Association of
REALTORS® News
Get the latest news from NAR, including press releases, REALTOR® Magazine articles, and blogs covering all aspects of real estate.
Real Estate News
Your NVAR membership includes a complimentary subscription to RealEstateNews.com. This valuable benefit provides Realtors® with access to objective, relevant, and industry-trusted news, enhancing their knowledge and keeping them informed about the latest developments.


