During the winter months, the number of active listings increased in the NVAR region but at a slower pace than in prior months. The NVAR region includes Alexandria City, Arlington County, Fairfax County, Fairfax City and Falls Church City. This decreased rate of growth was part of a longer trend caused by a combination of higher rates of closed sales and somewhat lower rates of new listings. The inventory of some types of homes was increasingly tight, including single-family attached properties and mid-priced properties. This trend should reverse during the spring months, but it is likely that this pattern will re-emerge later in the year if demand is strong.
Between February 2015 and February 2016, active listings increased 1.5 percent for a total of 3,378 actives. As shown in Figure 1, the year-over-year growth rate declined steadily starting in April 2015, when active listings increased 33.3 percent.
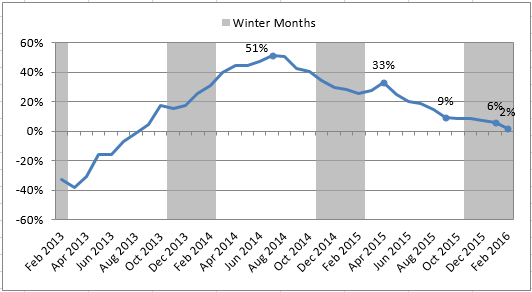
Unsold active listings reflect changes in both closed sales and new listings. In general, if units are being sold more quickly than new listings are being added, then active listings will fall or have a slower rate of growth. During 2015 and early 2016, closed sales picked up (especially during the summer months of 2015), and new listings did not always keep pace (Figure 2).

These year-over-year comparisons are partially showing the relatively weak demand in 2014. After the federal shutdown in October 2013, the number of closed sales in the NVAR region started to decline compared to the prior year. Buyer demand did not return until late 2014 or early 2015. During this time, new listings continued to rise, bolstering total inventory. Overall, new listings were being added to active listings at an increasingly greater rate than closed sales were taking units out of inventory. Since demand picked up in 2015, this trend shifted and inventory gains have been smaller by comparison.
"During 2015 and early 2016, closed sales picked up (especially during the summer months of 2015), and new listings did not always keep pace."
WHAT TYPES OF INVENTORY WERE TIGHT?
BY HOME TYPE
In February, there was just one month of supply for single-family attached homes. Condo properties and single-family detached homes had more than double that, with 2.3 months and 2.4 months, respectively. Winter months typically have low supply, as active listings are lower than during summer months and are compared to the demand from the past year. Nevertheless, all housing types had fewer months of supply than during the same time in 2015, which indicates that seasonal trends are not the only factor. While the increase in buyer demand played a role for all housing types, the number of active listings has been a factor for single-family attached homes.
Single-family detached homes continued to be the largest share of active listings. This housing type usually drives the total change in active listings. Figure 3 shows the number of active listings in February of each year from 2013 to 2016.
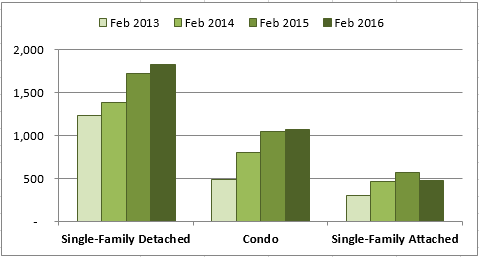
The February-level of active listings for single-family detached homes was higher in 2016 than in the prior three years. The same was true for condo properties; however, the difference between February 2015 and February 2016 was significantly smaller than the prior year's changes. For these home types, the decrease in the months of supply only reflected higher demand, instead of fewer active listings. Single-family attached homes had fewer actives in February 2016 than in the prior year, reducing the months of supply. Despite the decline, active listings of single-family detached homes remained above their February level in 2014.
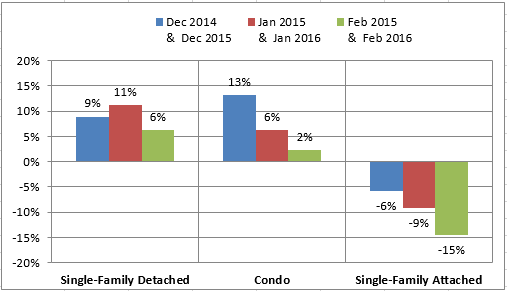
The year-over-year changes during the winter months showed an acceleration of some of these trends, principally for condo properties and single-family attached homes. The percent change in active listings of single-family attached homes became increasingly negative (Figure 4). Likewise, the percent increase in active listings of condo properties stepped down considerably. The growth in single-family detached active listings was more consistent and rose between 5 and 11 percent.
New listings for single-family attached homes decreased compared to the prior year. Closed sales for this property segment dropped off as well during the winter months, which may have been a result of a lack of new inventory.
BY PRICE
Four price groups had fewer active listings in February 2015 than in February 2016: $200,000 to $299,999, $300,000 to $399,999, $600,000 to $799,999 and $800,000 to $999,999. Additionally, a step-down in the rate of growth occurred for several price groups (Figure 5). Only homes listed at more than one million dollars had consistent year-over-year growth in active listings during the winter months.

One price group with active listings gains, homes listed for $400,000 to $599,999, still had a decrease in the months of supply in the market (Figure 6). In fact, nearly all price groups had fewer months of supply than last year, even if inventory increased.

"...[If] buyer demand remains strong, new listings will be absorbed and pull down the growth in inventory as 2016 continues."
In particular, the supply of homes listed between $300,000 and $799,999 was low, with fewer than two months of supply. New listing growth was also weak in this price range, and these homes were selling more quickly, on average, than their lower- and higher-priced counterparts. New listings in the spring will help to replenish the supply of these homes, but demand should also rise and absorb much of the new supply as the spring progresses.
BY NUMBER OF BEDROOMS
As shown in Figure 7, three-bedroom homes had the fewest months of supply (1.3 months) in February 2016, followed by four-bedroom homes (1.8 months). Three-bedroom homes also had a year-over-year decline in active listings, which contributed to the inventory decline.
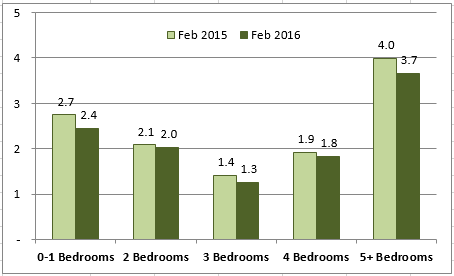
In addition to three-bedroom homes, studio and one-bedroom homes were the only other group that had fewer active listings than last year (Figure 8). These homes are often condos or single-family attached homes and follow similar trends.
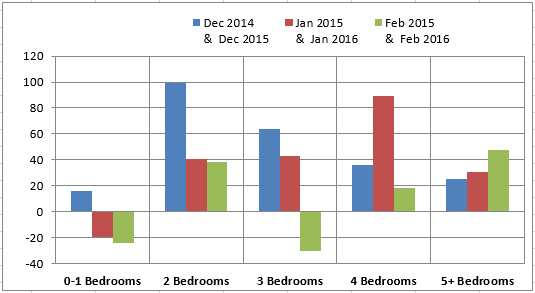
Three-bedroom homes also had weak new listing activity, which most likely contributed to lower closed sales rates. Studios and one-bedroom homes accounted for a small share of the overall sales, but may also be tight going forward.
OUTLOOK
Inventory continued to increase during the winter months but at a slower rate than during the summer. Closed sales were relatively strong while new listings did not keep up. This led to low inventory, especially for townhomes, mid-priced homes and three-bedroom units. First-time buyers and young families may have had a difficult time finding homes, as they may be looking in that price range. The influx of spring listings will increase the months of supply and the rate of growth for inventory, as it did last year. However, if buyer demand remains strong, new listings will be absorbed and pull down the growth in inventory as 2016 continues.