Recent News
Market Statistics: October 2025
The Northern Virginia Association of Realtors® reports on October 2025 home sales activity for Fairfax and Arlington counties, the cities…
November 12, 2025

National Market Statistics Comparison: September 2025
The Northern Virginia Association of Realtors® reports on September 2025 home sales activity in Northern Virginia compared to real estate activity…
October 28, 2025

Market Statistics: September 2025
The Northern Virginia Association of Realtors® reports on August 2025 home sales activity for Fairfax and Arlington counties, the cities…
October 13, 2025

National Market Statistics Comparison: August 2025
The Northern Virginia Association of Realtors® reports on July 2025 home sales activity in Northern Virginia compared to real estate activity…
October 8, 2025

Market Statistics: August 2025
The Northern Virginia Association of Realtors® reports on August 2025 home sales activity for Fairfax and Arlington counties, the cities…
September 10, 2025

NVAR’s Global Programming Recertified as Diamond Global Achievement Council
We are honored to announce that the Northern Virginia Association of Realtors® (NVAR) has once again earned DIAMOND status, the…
November 20, 2025

Discover the New NVAR Loudoun Member Experience Center at One Loudoun®!
Have you been to the new NVAR Loudoun Member Experience Center at One Loudoun®? This dynamic member destination was designed…
November 10, 2025

The 2025 General Election: Here’s What You Need to Know
The 2025 general election is officially underway! Election Day is November 4, but you don’t have to wait until then…
October 31, 2025

The Next Phase of the NVAR Mobile App Is Here!
NVAR is proud to unveil the next phase of our mobile app — your one-stop connection to everything NVAR. Designed…
October 28, 2025

The Brand-New nvar.com is Here!
We have completely reimagined our award-winning website to make your member experience simpler, smarter, and more personalized. With an upgraded…
October 16, 2025

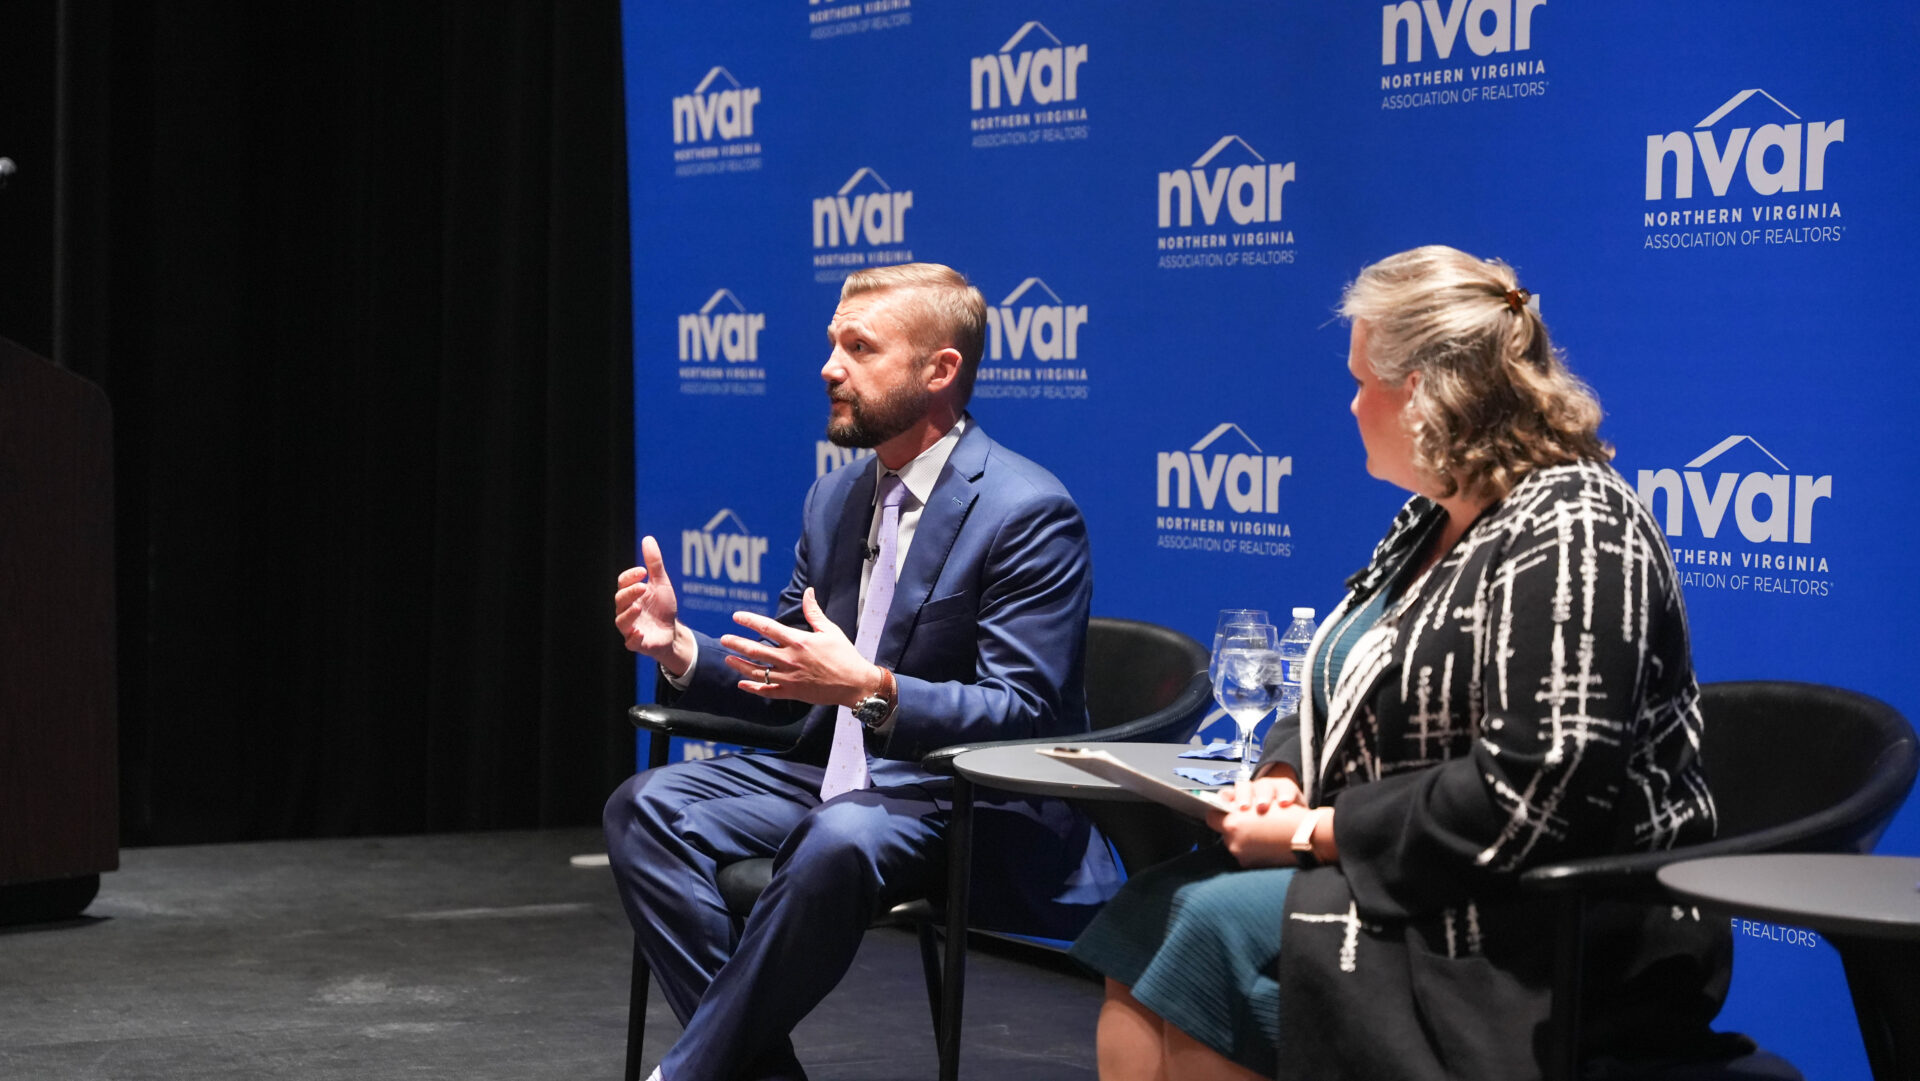
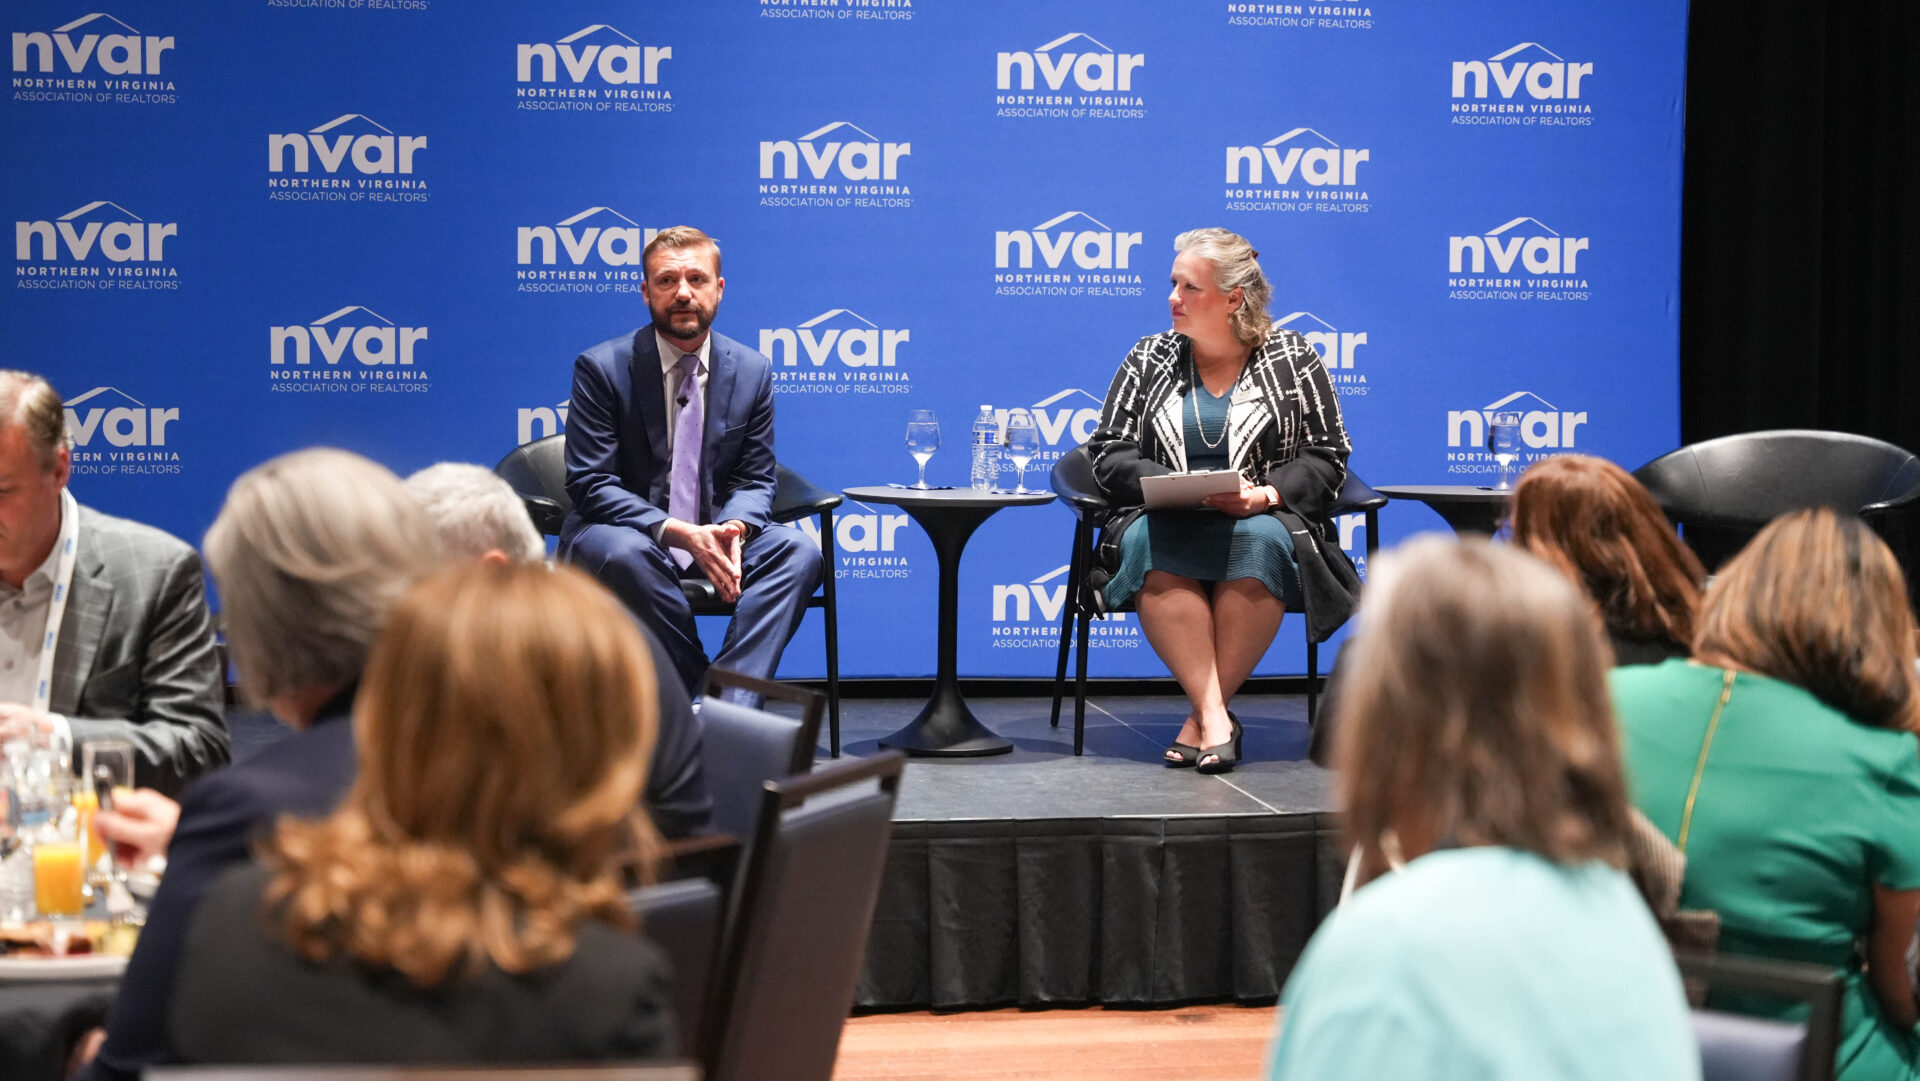
Bridging the Aisle Over Breakfast: Politics and Pancakes at INSPIRE25
INSPIRE25, NVAR’s Annual Convention and Trade Show, brought together real estate professionals and policymakers for “Politics and Pancakes,” a breakfast…
October 18, 2025

FIVE FOR FRIDAY: A Weekly Roundup of Public Policy News
Welcome to FIVE FOR FRIDAY: A weekly roundup of public policy issues and headlines from around the Northern Virginia Region,…
October 17, 2025

FIVE FOR FRIDAY: A Weekly Roundup of Public Policy News
Welcome to FIVE FOR FRIDAY: A weekly roundup of public policy issues and headlines from around the Northern Virginia Region,…
October 14, 2025

FIVE FOR FRIDAY: A Weekly Roundup of Public Policy News
Welcome to FIVE FOR FRIDAY: A weekly roundup of public policy issues and headlines from around the Northern Virginia Region,…
October 8, 2025

FIVE FOR FRIDAY: A Weekly Roundup of Public Policy News
Welcome to FIVE FOR FRIDAY: A weekly roundup of public policy issues and headlines from around the Northern Virginia Region,…
September 12, 2025

Standard Forms Changes — July 1, 2025
The NVAR Board of Directors has approved new forms and forms changes, as proposed by the NVAR Standard Forms Committee.…
June 4, 2025

January 1, 2025, Standard Forms Updates
The NVAR Board of Directors has approved the below new forms and forms changes, as proposed by the NVAR Standard…
November 25, 2024

Special Standard Forms Changes – August 14, 2024
The NVAR Board of Directors has approved the below new forms changes. The changes will be effective August 14, 2024.
August 5, 2024

Standard Forms Changes – July 1, 2024
The NVAR Board of Directors has approved the below new forms changes, as proposed by the NVAR Standard Forms Committee…
May 29, 2024

January 1, 2024 Standard Forms Updates
The NVAR Board of Directors has approved an update of the following forms changes, as proposed by the NVAR Standard…
November 28, 2023

Standard Forms Changes — July 1, 2025
The NVAR Board of Directors has approved new forms and forms changes, as proposed by the NVAR Standard Forms Committee.…
June 4, 2025

FAQs on NAR’s New Multiple Listing Options for Sellers Policy
The National Association of REALTORS® (NAR) recently announced that it will keep its Clear Cooperation Policy (CCP) in place and…
March 28, 2025

Judge Approves NAR Settlement in Sitzer/Burnett Case
The National Association of REALTORS®’ settlement resolving antitrust claims brought against NAR and others in the Sitzer/Burnett case has been…
November 27, 2024

January 1, 2025, Standard Forms Updates
The NVAR Board of Directors has approved the below new forms and forms changes, as proposed by the NVAR Standard…
November 25, 2024

November: Legal Hotline Questions of the Month
The NVAR Legal Hotline has received many questions regarding voiding and releasing sales contracts this fall. Refresh your skills with…
November 15, 2024

Looking for more expert analysis?
Virginia Association of REALTORS®
View the archive of Virginia REALTORS® press releases on housing market statistics, leadership and community engagement, and policy issues.
National Association of
REALTORS® News
Get the latest news from NAR, including press releases, REALTOR® Magazine articles, and blogs covering all aspects of real estate.
Real Estate News
Your NVAR membership includes a complimentary subscription to RealEstateNews.com. This valuable benefit provides Realtors® with access to objective, relevant, and industry-trusted news, enhancing their knowledge and keeping them informed about the latest developments.


