Looking Back At Numbers That Matter
The NVAR region housing market had uneven increases in closed sales in 2016 compared to 2015. Inventory gains weakened as the year progressed and ended below its 2015-level. Price growth was modest and led by increases in single-family detached homes.
ECONOMIC TRENDS
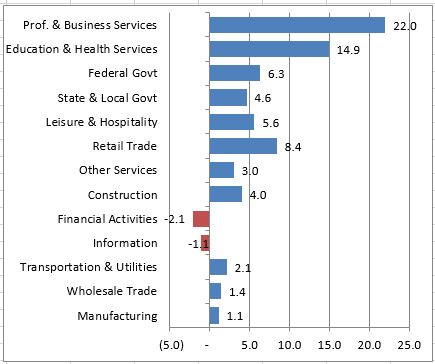
The Washington region had strong job growth throughout the year and is on track to add an annual average of about 73,000 jobs. This would be the highest annual gain since 2000. Between October 2015 and October 2016, the Washington region – including the District, five counties in Maryland, 17 jurisdictions in Virginia and Jefferson, WV – added 70,200 jobs, including 28,200 jobs located in Northern Virginia. Throughout the region, job growth was led by the Professional & Business Services sector, which added 22,000 jobs. These large gains bode well for total 2016 wage growth.
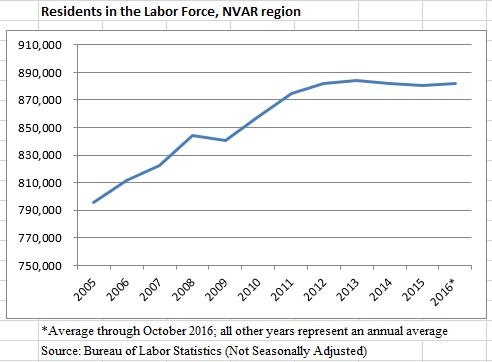
Despite the growth in payroll jobs throughout the Washington region, the number of residents in the labor force in the NVAR region has been stagnant since 2012. The labor force includes residents who are either employed or actively looking for a job. In 2012, the NVAR region had an average of 882,100 residents in the labor force. By 2013, this number had grown by just 0.3 percent, or 2,360 residents. In 2014, the NVAR region had fewer residents in the labor force when compared to 2013, and even fewer still in 2015. While most areas in the region experienced a slow-down during this time, the decrease in the NVAR region began earlier and was more pronounced than in other areas. In 2016, the NVAR region labor force stabilized and is on track to have modest gains.
Demographics are likely playing a role in the stagnation of the labor force in the NVAR region, as residents may be retiring at a faster rate than the working-age population is growing. In general, younger households move more frequently than older households. If younger workers are being added to the NVAR region at lower rates than in the past, it is likely that housing turn-over will also be suppressed. Among recent retirees, a larger share are remaining in their homes, instead of immediately downsizing. So any uptick in retirement will have a minimal near-term impact on the housing market.
“In 2017, inventory will be the key to a strong housing market.”
NEW CONSTRUCTION
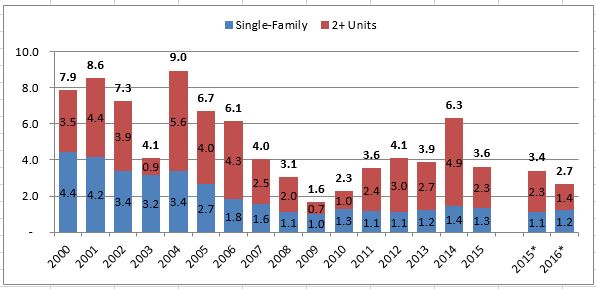
New construction in the NVAR region was subdued in 2016. There were 1,230 single-family attached and detached permits issued through October, about 12 percent more than during the same period in 2015 but well below the pre-2007 average. Multi-family permits through October fell by 1,060 permits, or 37 percent, when compared to the same period in 2015.
Overall, the total number of permits in 2016 were on track to be the lowest total since 2010, primarily driven by the decline in multi-family units. The number of single-family home permits were on track to be in line with, or modestly above, the post-recession trend.
EXISTING HOME SALES
Inventory and Closed Sales
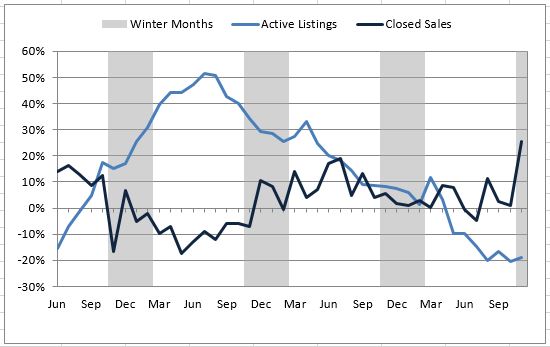
Closed sales in the NVAR region increased 4.4 percent in the first 11months of 2016 compared to the same period in 2015. But the increase was not uniform throughout the year, with the largest gains occurring in April, May and August, and declines occurring in June and July. The declines that occurred early in the summer were likely a result of low inventory and time to settle.
In November 2016, there were 19 percent fewer unsold active listings on the market when compared to 2015. Inventory reached its lowest November-level since 2013 and fell from the prior year for most of 2016, continuing the step-down in growth that began in the middle of 2014. Despite this, inventory remained higher than its 1999-2004 levels.
The overall increase in closed sales during the first 11 months of 2016 was driven entirely by increases in Fairfax County, which had 6.1 percent more sales than during the same period in 2015. The number of closed sales in Arlington increased 1.2 percent or by 30 sales, while those in Alexandria increased 0.1 percent, an increase of three homes sold. Sales in Fairfax City fell 6.5 percent and sales in Falls Church City decreased 1.8 percent during this period.
The demand for 2016 condo homes had the largest growth and rose 9.5 percent, or by 473 sales, compared to the same period in 2015. The number of single-family detached home sales increased 3.9 percent, or by 333 sales. The number of last year’s single-family attached homes had the smallest growth in sales, rising 0.4 percent or by 21 sales, compared to the same period in 2015.
AVERAGE SALES PRICE
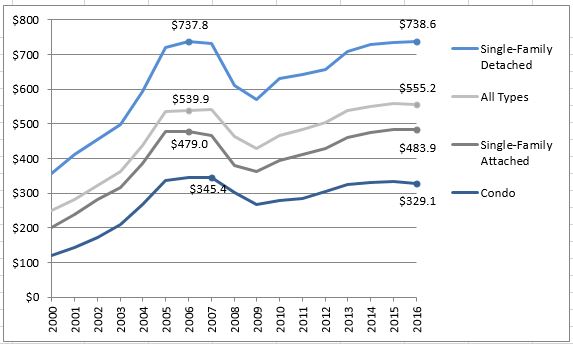
In the first 11 months of 2016, the average sales price was $555,190 and 0.4 percent lower than in the same period of 2015. This decline was primarily due to the relatively high number of condo sales; both single-family detached and single-family attached homes had sales price gains. At $738,612, the average price of a single-family detached home rose 0.4 percent from the same period in 2015. The average price of a single-family attached home increased 0.1 percent, rising to $483,880. Condo properties had a lower average sales price than in 2015, falling 1.3 percent to $329,108. Overall, the average home sales price growth flattened, with only modest changes since 2013.
Of the NVAR jurisdictions, Falls Church City led in sales price growth (up by 9.9 percent). No other jurisdiction had average price gains in the first 11 months of 2016 compared to the same period in 2015. The average sales price in both Fairfax and Arlington declined 0.2 percent. The average sales price was 2.1 percent lower in Fairfax City through November 2016 compared to the same period in 2015, while that in Alexandria fell 2.4 percent.

POST-ELECTION OUTLOOK
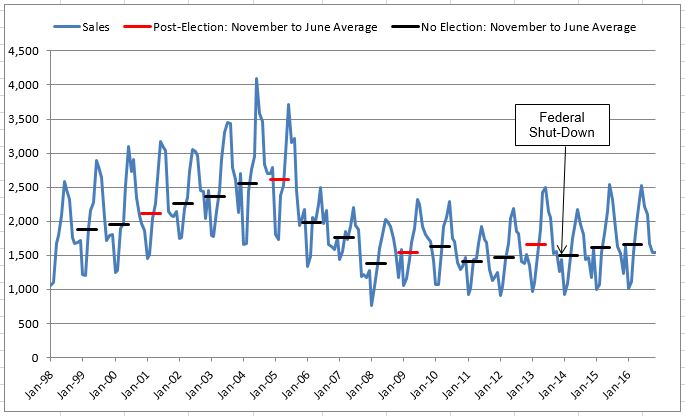
Will the NVAR region see a jump in sales because of the new administration? Based on historic patterns, probably not a noticeable one. Figure 6 shows the closed sales in the NVAR region and the average number of November to June sales for each year (November 1999 to June 2000, etc.). In a post-election period, the average November to June sales did not differ significantly from what would be expected given the longer-term trends.
Overall, the housing cycle seems to be the dominant factor post-election, with any election-specific difference being minor. A notable exception appears to be after the 2012 election, but the following year marked a pivot in the housing market, exacerbating the appearance of a post-election boom. Closed sales had been on the upswing since 2011 and the November 2012 to June 2013 period had relatively strong growth compared to the prior two years. Following this period, sales decreased in the aftermath of the Federal shut-down in October 2013 and continued weak job growth within the region. By comparison, the post-election period appeared even stronger.
CONCLUSION
In 2017, inventory will be the key to a strong housing market. The pool of homes for sale is likely to remain subdued as retirees remain in their homes for longer, and new construction will not be able to fill this gap. An increase in job growth often results in higher sales volume, but only when it translates to labor force growth in the NVAR region.
For the past several years, this has not been the case. The labor force has plateaued, and closed sales have had only modest gains. In part, this may be due to low inventory: potential new home buyers, likely to be in the labor force, have not been able to buy in the NVAR region and may be looking elsewhere. As 2017 opens, this trend may persist, regardless of any post-election impact.
Jeannette Chapman is a research associate with the George Mason University Center for Regional Analysis.