Number of Newcomers Declines; Wage Growth Could Still Spark Housing Demand
Where is it Occurring, and How High Will it Go?
Clearly, home prices in Northern Virginia are exorbitant and continue to rise. Low inventory levels and high demand have propelled the median sales price to its new peak, and pushed the median number of days that a home is on the market to a new low.
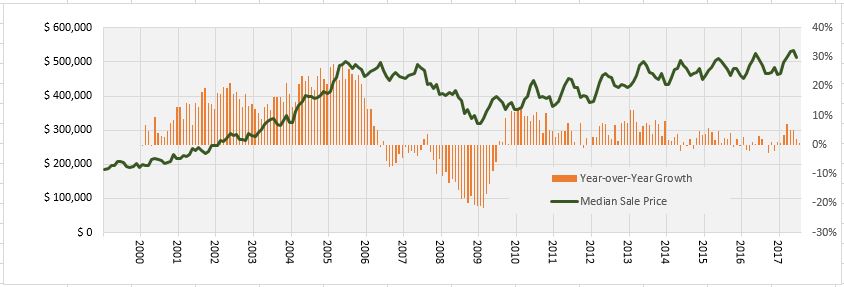
Home price appreciation is widespread across the nation, but particularly pervasive in Northern Virginia. Within the region, there exists wide variation in home sale price by location and housing type. When will it stop?
At some point, people will hit their breaking points and refuse to pay premium rates for a home that does not fully match their needs or desires. Nevertheless, multiple factors are at play that influence the housing prices, and the extent of that rise may not be easy to determine.
OVERVIEW
From July 1999 to July 2017, the median home sale price in the NVAR region has appreciated 146.5 percent or 8.2 percent on average annually, based on the multiple listing data. Much of this growth occurred building up to the real estate crisis beginning in mid-2007. However, in 2013, that price surpassed the July 2005 pre-recession peak of $501,556 and has been climbing higher since. The median home sale price in the NVAR region reached $535,000 in June – the highest month on record.
This is not just a local phenomenon – but a national trend as well. Nationally, the median existing-home price for all housing types in June was $263,800 according to the National Association of Realtors®. This surpasses May, at $252,800, as the highest median sales price on record, and marks the 64th straight month of year-over-year gains. In addition, the median sales price of new US homes in June was $310,800. This represents an appreciation of 103.5 percent or 5.2 percent on average annually over the past 20 years.


MEDIAN HOME SALE PRICES DIFFER WIDELY BY ZIP CODE
Further breaking down the median sale price number into smaller geographies gives additional insight into local price dynamics. The high volume of housing sales in the region makes this possible and reasonably trustworthy.
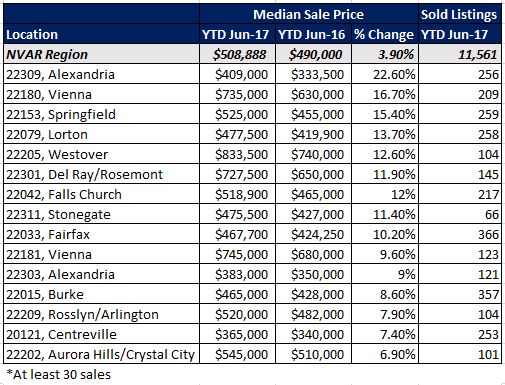
The analysis below portrays the median housing sales price for Zip codes in the NVAR region for the first half of 2017, which includes all year-to-date sales for 2017. It is important to note that areas with high condo volumes are likely to see lower sales prices, due to lower condo price points. For example, lower sale prices in the Rosslyn-Ballston corridor can partially be contributed to the concentration of condo properties, as opposed to more expensive single-family homes in North Arlington.
The most expensive Zip codes in the NVAR region tend to be in the north end of the region. McLean’s 22101 in Fairfax County displayed the highest first-half 2017 median sales price for the region at just over $1 million – nearly double the region median of $508,888.
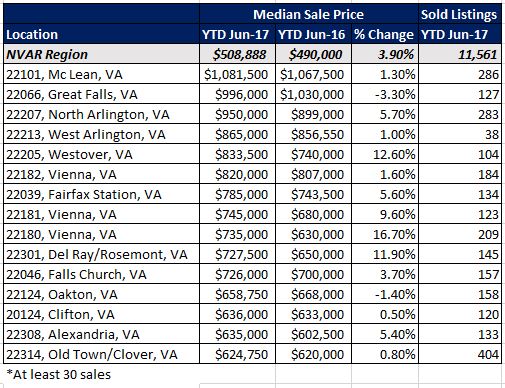
Great Falls’ 22066 and North Arlington’s 22207 followed closely behind with sales prices just under $1 million. The most affordable NVAR Zip codes are Falls Church’s 22041, at the median price of $266,000, Cameron Station’s 22304 at $365,000, and Braddock Heights’ 22302, at $349,450.
COUNTY LEVEL HOME PRICES ARE CONSISTENT WITH THE REGION
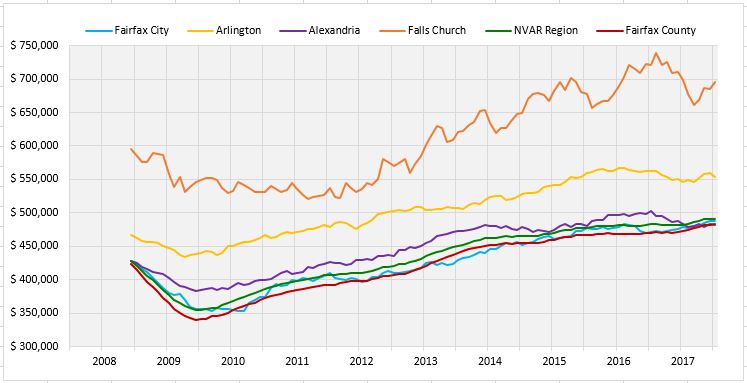
The counties and independent cities that comprise the NVAR region follow the broader regional price trends. Falls Church consistently remains the most expensive jurisdiction (July 2017 median sale price $830,000), followed by Arlington ($567,500), then Alexandria, Fairfax County and Fairfax City averaging close to $500,000. Since the low in 2009, Fairfax County, Arlington and Alexandria have all grown about 5 percent annually on average in median sale price. Within the past four years, since 2013, Arlington’s home values have risen consistently at 4.5 percent annually, while Fairfax County and Alexandria’s price growth has slowed to around 2 percent on average each year.
SINGLE-FAMILY HOME SALE PRICES HAVE GROWN THE FASTEST
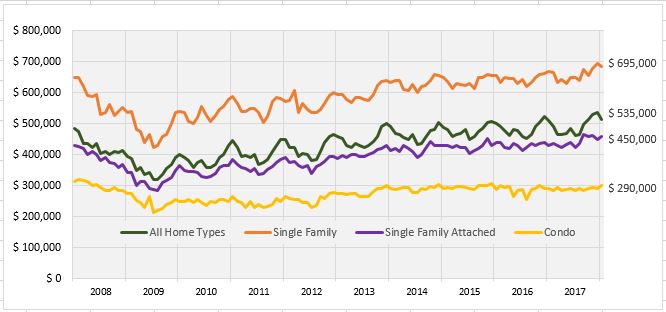
Price growth in the single-family home sector has driven the overall rise in regional median home sale values, while condo prices remain relatively stable. Single-family detached and attached homes have each appreciated in price nearly 30 percent, at 2.8 percent annually, since their low in 2009. This is compared to the condo sector which grew 18 percent, at 1.8 percent annually, in median sale price over the same period. Condo values have stalled significantly in the past four years. Since June 2013, condo values have decreased about 3 percent or 0.8 percent annually on average. These trends persist across the Washington Metropolitan Area, and are not unique to Northern Virginia.
”Expect local home prices to continue rising throughout the rest of 2017 and likely into 2018.”
HOUSING PRICES CAN’T RISE FOREVER…OR CAN THEY?
The answer to this million-dollar question is a complex story of supply versus demand. The tight supply of existing homes on the market continues to constrain sales, while low mortgage rates —at least for now — and job growth help fuel demand. This pushes up prices while relief from new home construction is lagging and is only at half of its pre-recession peak. The number of housing units completed in May was 96,700 compared to 187,500 in December 2005 (US Census Bureau, New Residential Construction).
At the same time, home prices are rising faster than income and wage growth. Eventually prices will reach a point where people will not buy, followed by a slowdown in price growth. Homebuyers will eventually choose to live in regions that offer similar job opportunities but a cheaper cost of living.
This has already begun to occur as evidenced by the region’s net domestic outmigration – which is not only occurring in Northern Virginia, but throughout the greater Washington D.C. region. Each year since 2011, more domestic residents are leaving the NVAR region than moving in from elsewhere in the US; resulting in a net decrease of about 25,000 people domestically. Although a slowdown in price growth is beneficial to the affordability and viability of the long-term real estate market, residents leaving or avoiding the region is not ideal for the overall local economy.
Many are asking if this is a new housing bubble forming that will lead to prices crashing as they did one decade ago. The circumstances are different this time, as housing prices are not being pushed up by a “false demand” made possible by over-lending, but rather by a low supply. In the normal cycle of supply and demand, new, more affordable housing would be built, and prices would decline.
However, builders are not building and existing homeowners of lower priced housing stock are not moving. It is much harder for builders to obtain financing from banks for large projects, and the cost of building has increased greatly in the last 10 years, about 37 percent, based on RSMeans building construction cost indexes. Homeowners recognize that they will not be able to replace their own homes as prices soar. It makes financial sense to stay put rather than sell and try to move up.
Affordable housing incentives for builders would provide momentum for growth in lower priced housing and provide opportunities for first-time homebuyers to afford entry-level homes. However, the mix of housing types at different price points is unlikely to change in the short term. Given homebuilding will not rise, the extent of home price escalation is largely dependent on wage growth in the region—specifically for those of lower and middle incomes.
When adjusted for inflation, the average wage in the NVAR region has decreased slightly since 2010, from $81,600 in 2010 to $80,700 in 2016, and has only grown about 1 percent annually on average since 2000. Wage growth, through the creation of higher paying jobs, could jumpstart the supply and demand cycle, allowing a range of available homes affordable in all price points.
The reality is that the point of housing price equilibrium may not happen for some time. When looking to other US localities that are ahead of this region in home price growth – such as the San Francisco Bay area and New York City – it is clear that housing values can continue rising to astronomical figures. Expect local home prices to continue rising throughout the rest of 2017 and likely into 2018.
Spencer Shanholtz is a research associate with the George Mason University Center for Regional Analysis.