SINCE THE END OF THE GREAT RECESSION, more real estate and financial professionals have preached about the economic benefits of home buying as opposed to renting. The reasoning behind this was attributed to: low prices, high rents, excess inventory of homes for sale, and historically low mortgage interest rates. Nearly 10 years later, the D.C. area has record low inventory, record high prices, and rising mortgage interest rates.
This report updates a 2013 buying versus renting evaluation prepared by the GMU Center for Regional Analysis. As the housing landscape has shifted significantly in the past five years, these new regional dynamics call for a fresh look at the economics behind the better decision: to buy or rent a home.
CHANGING CONDITIONS AND COMPLICATED DECISIONS
Tight inventory and rising interest rates put upward pressure on home prices. In March 2018, there were 2,893 active listings in the NVAR region – 21.1 percent lower than March of 2017 and the lowest March number in five years. The NVAR region’s median sales price in March 2018 of $514,500 was 16 percent higher than five years ago in March 2013, and the region’s highest March price in more than a decade.
This median sales price now surpasses the pre-recession peak of $491,200, reached in June 2007.
According to Kathy Orton of the Washington Post, the 30-year fixed rate home loan at the end of April rose to a level not seen since August 2013. The Federal Reserve raised the benchmark interest rate this past March, further contributing to mortgage rate increases. Provided continued job growth, low unemployment, and a generally strong economy continue, we can expect at least two more rate hikes from the Fed in 2018.
Potential homebuyers weigh competing factors about whether they should buy now or continue to rent, with the hope that prices moderate and interest rates stay low. These potential homebuyers typically need to determine if owning a home is a good investment compared to renting.
Answering this question depends on:
• The amount of savings that needs to be invested as a down payment;
• The difference in carrying costs between principal, interest, taxes, and insurance (PITI), as well as repairs and maintenance needed for an owned property, and how this compares to lease rate, usually monthly, on a rental property;
• The income tax benefits of writing off mortgage interest;
• Costs related to homeowners’ associations and/or condo fees;
• Projected rental cost increases over time; and
• Projected property value appreciation over time.
Online tools are available to help determine the “payback period” for buying a home – that is, how many years a buyer will need to own a home before it becomes a better financial investment than renting. Many Realtor® or homebuilder websites and associations provide these tools, which some prospective homebuyers might view as biased in favor of homeownership. Other “housing-neutral” organizations have developed similar tools, such as The New York Times (NYT) online calculator nytimes.com/interactive/business/buy- rent-calculator.html.
The GMU Center for Regional Analysis used the NYT tool to evaluate renting versus buying for the Washington, D.C. region’s six core jurisdictions: Washington, D.C.; Montgomery County, MD; Prince George’s County, MD; Arlington County, VA; Alexandria City, VA; and Fairfax County, VA (including the cities of Fairfax and Falls Church).
The evaluation considers single- family detached, townhouses, and multi- family units separately, and begins with a comparison of current market-rate sale and rental prices for each jurisdiction and unit type.
MEDIAN RENTAL AND SALE PRICES
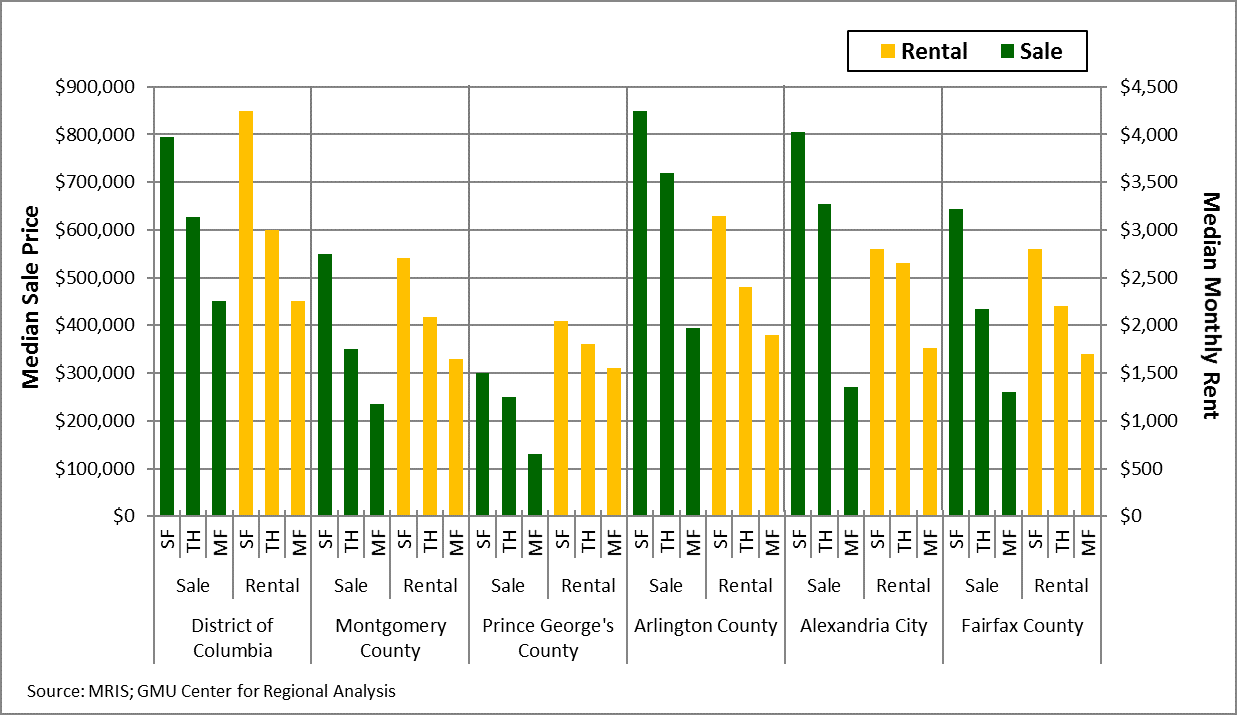
Home prices are highest in Arlington County, where the median price for single-family homes sold between January 1 and March 28, 2018 was $850,000 – 13 percent or $100,000 higher than the same period in 2013. The median townhouse in Arlington sold for $720,000, a gain of almost 5 percent since 2013. Arlington also has the highest median rental rate for multi- family units ($1,900), which is nearly identical to the rental rate during the same period in 2013.
The District of Columbia has the highest median prices for multi-family, for-sale units ($450,500) – an increase of 10 percent in five years, while the rental price of those same units increased nearly 20 percent to $2,250. Median prices for D.C.’s single-family rentals are the region’s highest as well at $4,250. The most expensive rental townhouses are also in D.C., with a median rental price of $3,000 per month.
Prices in suburban Maryland were lower than in D.C. or Virginia for both median sale and rental prices, with Prince George’s County having the lowest median levels for all unit and ownership types. Montgomery County has the next lowest prices for all categories, though its medians are only slightly below Fairfax County (Figure 1).
Figure 1: Median Rental and Sale Prices, January 1-March 28,2018

PAYBACK PERIOD
Using the current prices and rents listed in the NYT model, we estimated the number of years that it would take for buyers to recoup their investments into their homes. The analysis considers a range of variables, including the funds invested as a down payment, annual home value/rent appreciation, closing costs, needed maintenance and repair costs, utility subsidies for rentals, and HOA/condo fees. Additionally, the overall premise of this exercise relies on the assumption that a homebuyer can afford a down payment and qualify for a loan. The model also includes other assumptions about the relative costs of owning compared to renting (see box on facing page).
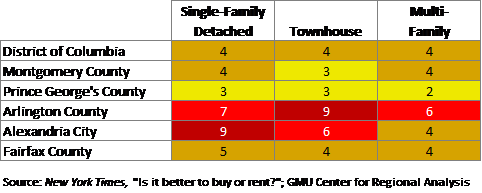
Owning a home becomes financially better than renting for all unit types and jurisdictions in the D.C. area in no more than nine years, and in four years or less in most situations (Table 1).
Table 1: Year When Owning Becomes Preferable to Renting

The quickest payback periods are in suburban Maryland, where home prices are lower. In Prince George’s County, ownership pays off in two or three years across all types. Montgomery County has the next fastest payback period, at three or four years. Despite high median purchase prices in D.C., the relatively high cost of renting keeps the breakeven period low at four years.
Arlington payback periods are the highest for townhomes (nine years) and multi-family units (six years). The payback period for single-family detached homes is highest in Alexandria at nine years. Sales inventory has not kept up with rental inventory, thereby causing relatively low rental prices compared to the soaring sale prices. This has increased the amount of time for ownership to pay off.
YEAR-FIVE SAVINGS FROM OWNING
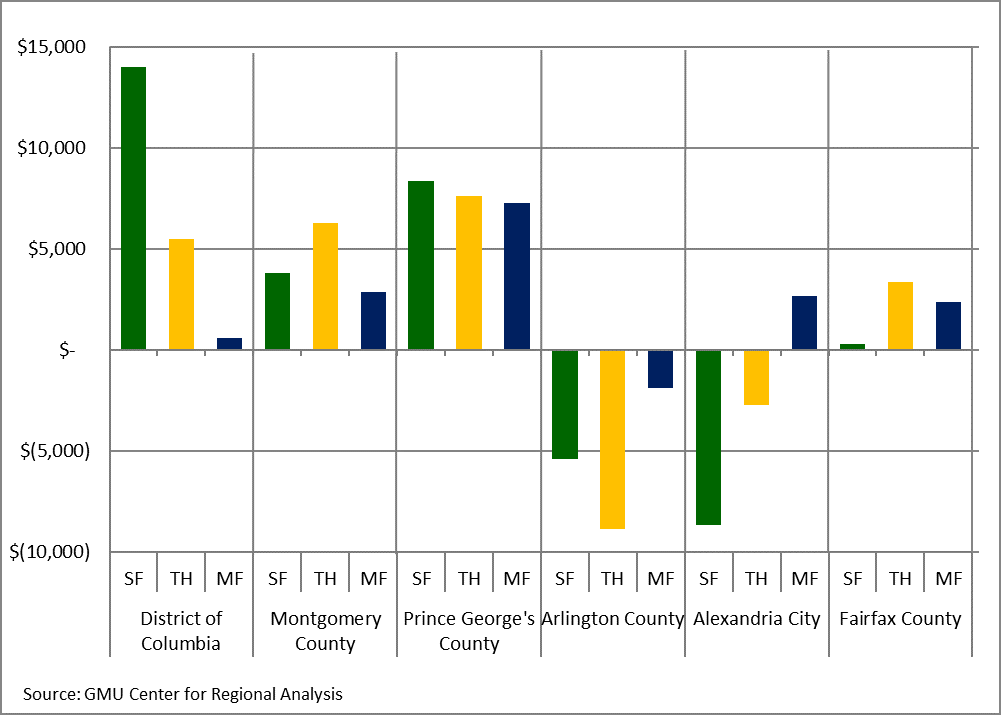
After five years, average annual savings from purchasing a home varies widely across jurisdictions. Savings are overall greater in D.C. and the Maryland suburbs, while Northern Virginia shows little to no financial return as of year five (Figure 2).
Figure 2: Average Annual Savings from Owning, Year Five

Single-family detached homes generate the greatest annual savings by year five in D.C. ($13,992) and Prince George’s County ($8,376). In both Montgomery and Fairfax counties, townhomes provide more savings than the purchase of a single-family unit at year five. Due to high sale prices and low rental costs, the purchase of a single-family home in Arlington and Alexandria does not pay off after five years on average.
Prince George’s County leads in savings for townhouses, where the buyer of a median-priced townhouse would save $7,625 in year five, followed closely by Montgomery County at $6,267. Among all home types and jurisdictions, Arlington townhouses show the greatest cost of ownership investment after five years at an average annual loss of $8,883 when compared to renting. This can be largely attributed to high supply and lower costs of rental townhome units when compared to the purchase price.
Across the board, the purchase of multi-family units shows the most consistent savings and thus the least risky ownership investment. The greatest year-five savings from buying a multi- family unit is in Prince George’s County ($7,278), as the county’s median multi- family sales price of $130,000 is the region’s lowest. The only jurisdiction not providing multi-family ownership savings over renting at year five is Arlington County (cost of $1,907). In Alexandria, multi-family is the only housing sector that shows annual savings from owning at year five ($2,679).
WHAT IF…? ANALYSIS
Several key inputs and assumptions were adjusted to better understand why payback periods and savings differ by housing type and jurisdiction (Table 2). This allows us to view alternative situations and outcomes, and provide an indication of which variables most impact the model. Fairfax County was chosen as the example since it has the largest sample size of transactions and its median prices are closest to regional medians. The following sensitivity variables were considered in this analysis: sale price, interest rate, value appreciation over time, and increased HOA/condo fees. Adjusting the down payment amount had virtually no effect on the model, so it is not cited here.
Table 2: Fairfax County Sensitivity Analysis, January 1-March 28, 2018

Interest rates and value appreciation have the greatest effect on the rent versus buy decision. If interest rates increased from their current level to 7 percent, the payback period would more than double for all property types, and the buyer of a median-priced single-family home would lose $13,407 in year five by owning instead of renting. If a home did not appreciate, the payback period would triple, and the year-five costs of owning a single-family home relative to renting would be $18,068.
The profound effects of having high interest rates or flat-value appreciation make sense, as both undermine homeownership’s financial advantages. If buyers pay more in mortgage interest and their home values do not increase, they will be spending more out of pocket each month without generating value from their investments. The sensitivity analysis shows that there is not much wiggle room if prices and interest rates continue to increase.
CONCLUSIONS
Potential homebuyers in the D.C. area have reasonable prospects for achieving positive financial returns, if they are willing to hold on to their property for at least four or five years and are strategic in choosing their housing type and residence location. With home value appreciation not showing any signs of slowing down and the regional economy trending upward, a home purchase is still a reasonable investment. However, with expected rising interest rates and increasing prices comes a sense of urgency: our sensitivity analysis shows that small changes can quickly make the rental option more cost-effective for some people.
Also, it is important to remember that the decision to own versus rent a home is not solely about the numbers; the additional benefits to homeownership are often worth the extra costs. Overall quality of life factors influence home buying and add to its value. These factors may include: safety of neighborhoods, quality of schools, recreation and transportation access, among others. Purchasing a home and putting down roots gives residents an investment and permanency in their community, leads to more civic engagement and even improved health.
While financial models can provide valuable input into the home buying decision-making process, they are just one part of the rent versus own analysis.
ASSUMPTIONS:
Assumptions incorporated into the model are based on national averages and locally-available data, as follows:
DOWN PAYMENT:
10 percent of purchase price
MORTGAGE TERMS:
30-year fixed, 4.24 percent annual interest, no points
AVERAGE BUYER’S FICO SCORE:
675
CLOSING COSTS:
Seller: 8 percent
Buyer: 3 percent
ANNUAL COSTS AS PERCENTAGE OF PURCHASE PRICE:
Maintenance: 0.50 percent;
Renovation: 0.50 percent;
Insurance: 0.25 percent
MONTHLY HOA/CONDO FEES:
Single-family: $ 98 Townhouse: $111 Multi-family: $400
ANNUAL VALUE APPRECIATION:
3 percent
ANNUAL RENT INCREASE:
3 percent
RENTERS’ INSURANCE COST:
1.32 percent of rent