To download The Northern Virginia Home Sales Report for August 2015, Click Here
Click Here to download the historical monthly data
Homeowner Equity Favorably Influences Seller Confidence,
14 Percent Hike in Active Listings Cited
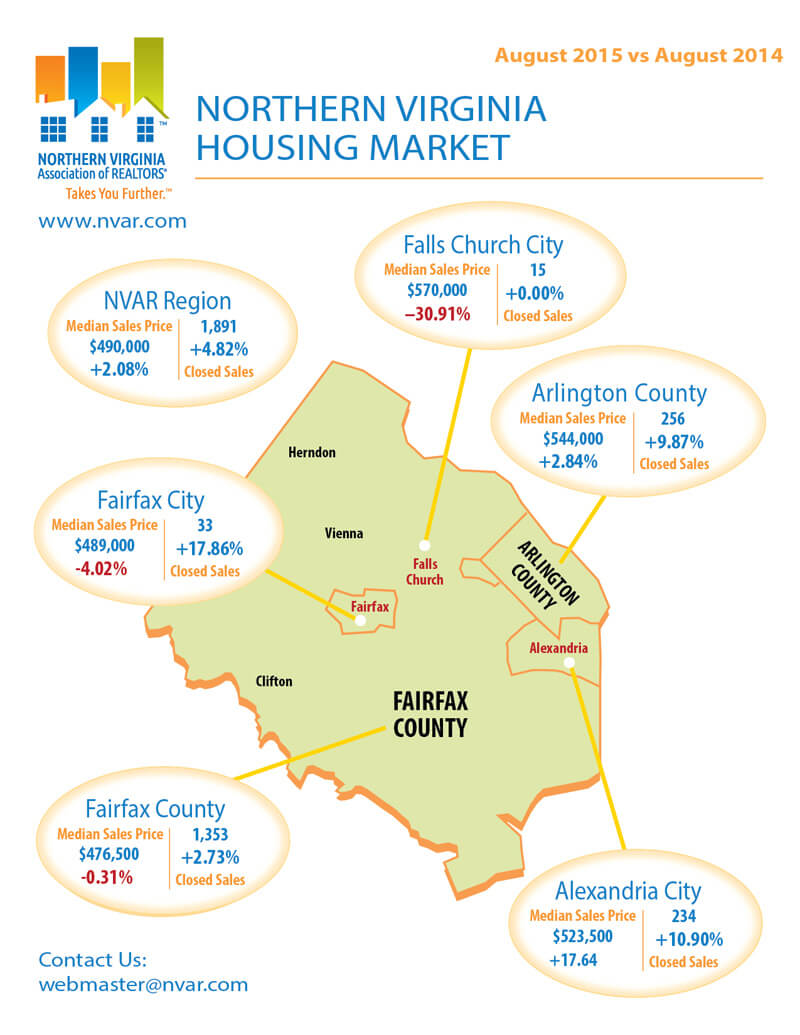
Fairfax – Looks like the median sales rates for different neighborhoods are literally and figuratively all ‘over the map.’ All real estate is local, and each zip code tells a different story for August. While the overall NVAR median price has risen by 2 percent in August, it is up in Alexandria and Arlington, down in Falls Church and Fairfax City and basically flat for Fairfax County. In August, Northern Virginia had a month’s supply of 3.02, up 9 percent above the available inventory in August last year.
“Our housing supply has been in an uptick for every month this year compared to that time last year. A steady climb of inventory is a net positive trend,” said Mary Bayat, 2015 chair of the board. “Selection is what savvy buyers prefer.
“Our active listings increased by more than 14 percent compared to last September which is a solid sign of seller confidence in Northern Virginia,” she continued. “In this respect, we are the poster child for a slowly but steadily recovering market. Many local sellers are satisfied with recent equity gains and have decided to take that next step.
“Most of our local key indicators are stronger than they were at this time last year, which underscores an improving housing market,” Bayat said. “But, our region is expensive and our first-time buyer market – meaning affordable housing – is one of our greatest challenges. As a result, many people remain renters. People still need to live within their means and make sure that their household budgets make sense for sustainable homeownership.
“Our active listings increased by more than 14 percent compared to last September which is a solid sign of seller confidence in Northern Virginia.”
“The year has been a good one for housing,” Bayat continued. “We hope it turns out to be a great one for salaries and stable employment, too.”
Speaking at NVAR’s Sept. 9 Economic Summit, Dr. Lawrence Yun, National Association of Realtors® chief economist said, “Northern Virginia is showing statistically slightly better than the nation in home sales, slightly under in terms of home price growth. On average, Northern Virginia is following the national trend.” Yun went on to explain that in areas of the country where there is job loss, or slow job growth, the housing market is much weaker, “so it’s all about jobs.”
August 2015 Regional Home Sales Compared to August 2014: Northern Virginia
The Northern Virginia Association of Realtors® reports on August 2015 home sales activity for Fairfax and Arlington counties, the cities of Alexandria, Fairfax and Falls Church and the towns of Vienna, Herndon and Clifton.
A total of 1,891 homes sold in August 2015, a 4.82 percent increase over August 2014 home sales of 1,804.
Active listings continued to show an increase this month compared with 2014. Listings were up by about 14 percent over last year, with 5,703 active listings in August, compared with 4,986 homes available in August 2014. Homes took slightly longer to sell this August than last year. The average days on market (DOM) for homes in August 2015 was 47 days, an increase of about 12 percent compared to the 42 DOM for homes in August 2014.
The average home sale price held steady this August, at $559,988. This is a less than 1 percent decrease compared to August 2014, when the average price was $562,499.
The median sold price of homes rose slightly this August, to $490,000.This is 2.08 percent above the August 2014 median price of $480,000.
The 1,799 new pending home sales in Northern Virginia in August is an increase of 10.23 percent compared with 1,632 pending contracts in August of last year.
Housing and Market Statistics are sponsored by:
