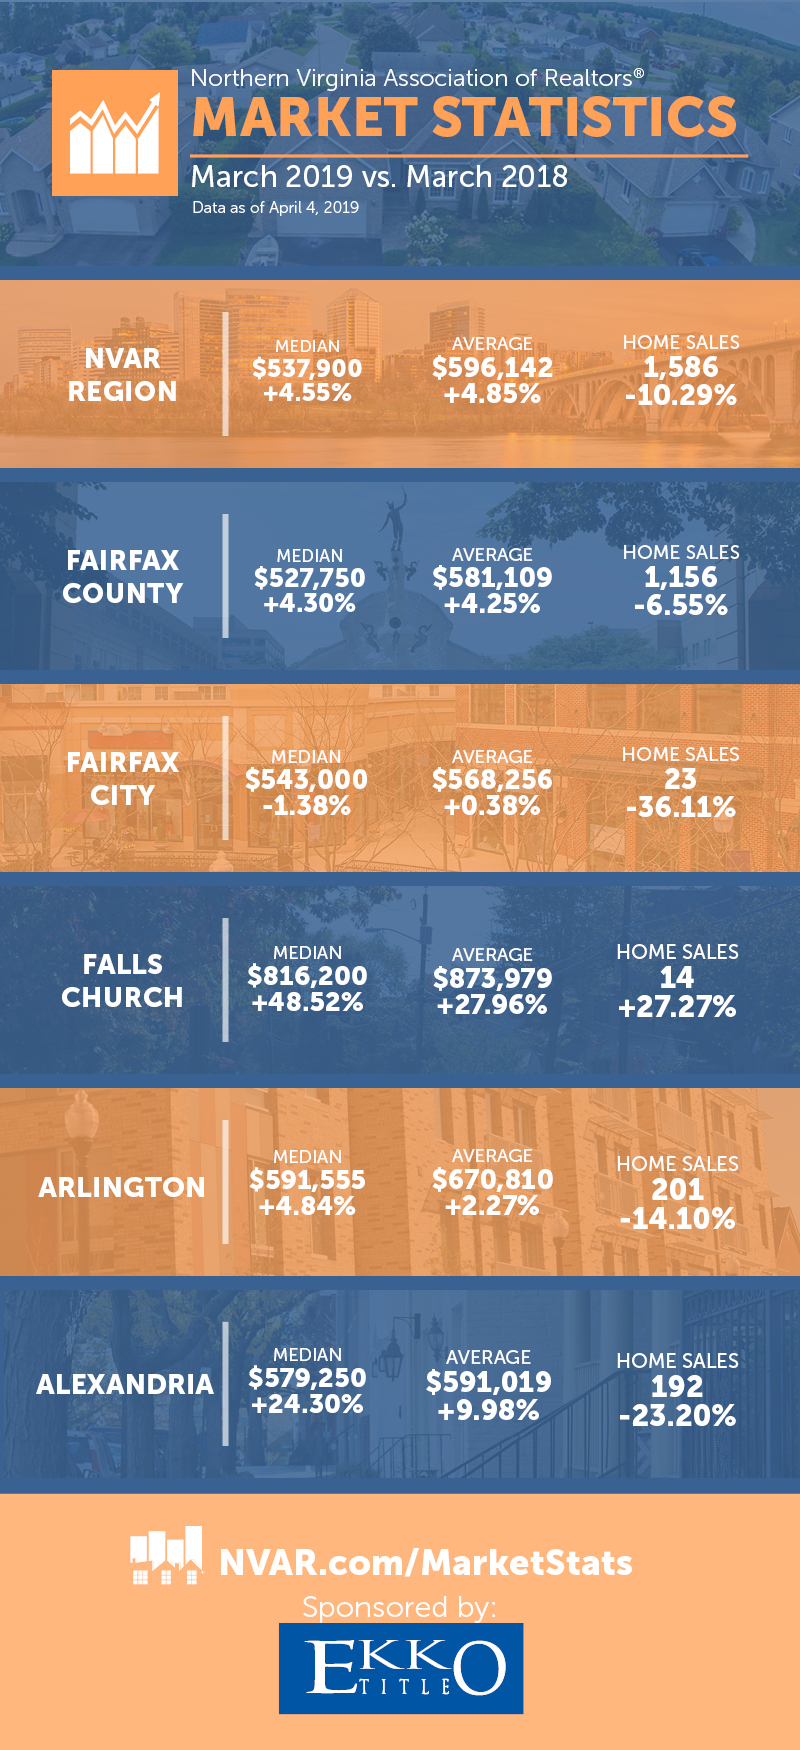
Data as of April 4, 2019
View Home Sales Report Here
View Full Press Release Here
Home Sellers Win in Northern Virginia’s March Housing Market Madness
Q1 Prices Reflect Steady Monthly Increases
Home prices are on a steady rise in the Northern Virginia Association of Realtors® (NVAR) footprint, reflecting high demand for a limited number of available listings. The NVAR region covers Alexandria City, Arlington County, Fairfax County, Fairfax City and Falls Church City.
For the third consecutive month, the average home sale price in the NVAR region has grown. The average price in March, which was $596,142, was 4.33 percent above the February average of $571,375, and 5.5 percent greater than the January average price of $565,032. The year-to-date March average of $578,825 was 2.5 percent higher than the 2018 year-to-date March average of $564,796.
The year-over-year price differential has also been increasing each month since the beginning of 2019. In January of this year, the average year-over-year price differential was a negative .47 percent, and in February, the year-over-year price differential was a positive 2.62 percent. In March, the average sales price was 4.85 percent higher than in March of last year.
“Diminishing inventory is certainly a factor contributing to rising prices this year,” says 2019 NVAR President Christine Richardson of Weichert, Realtors®. “Open house traffic is way up, and multiple offers are the norm at the most desirable price points. Low interest rates are also motivating buyers to act now. The average rate for a 30-year fixed mortgage edged down compared to last week and is now hovering just above 4 percent. Buyers understand that these rates continue to be at historic lows,” Richardson says.
Economic indicators are favorable in Northern Virginia, explains NVAR CEO Ryan Conrad. “Our partners at the George Mason University Center for Regional Analysis (GMU-CRA) indicate that the regional economy is in great shape, with low unemployment, rising wages for private sector professionals, low mortgage rates and a positive job outlook,” Conrad says. “But we also know that the housing outlook has been at least temporarily affected by the opposing market impacts resulting from Amazon’s HQ2 and the federal government shutdown,” he says.
While the number of year-over-year sales in March dipped compared to 2018, that total is just 3.5 percent below the five-year average of March closed sales in the NVAR market.
For now, Northern Virginia homeowners who are ready to sell can expect more prospective buyers, fewer days on market and higher sales prices than those who sold at this time last spring.
March 2019 Regional Home Sales Compared to March 2018: Northern Virginia
Data as of April 4, 2019
The Northern Virginia Association of Realtors® reports on March 2019 home sales activity for Fairfax and Arlington counties, the cities of Alexandria, Fairfax and Falls Church and the towns of Vienna, Herndon and Clifton.
A total of 1,584 homes sold in March 2019, a decrease of 10.41 percent below March 2018 home sales of 1,768.
Active listings decreased this month compared with 2018. Listings were down by about 23 percent below last year, with 2,221 active listings in March, compared with 2,891 homes available in March 2018. The average days on market (DOM) for homes in March 2019 was 39 days, a decrease of 31.58 percent compared to the 57 DOM for homes in March 2018.
The average home sale price rose by 4.85 percent compared with last March, to $596,142. The March 2018 average price was $568,576.
The median sold price of homes this March, which was $537,900, rose by 4.55 percent compared to the median price of $514,500 in March 2018.
Read more about the NVAR region housing market in GMU-CRA Market Metrics articles published in NVAR’s RE+VIEW magazine, found at NVAR.com/review.